
Discover how to use a Grade Curve Calculator in 2025 to adjust test scores fairly. Learn formulas like simple add‑on, ratio, bell‑curve (Z‑score), and step‑by‑step examples. Free resources included!
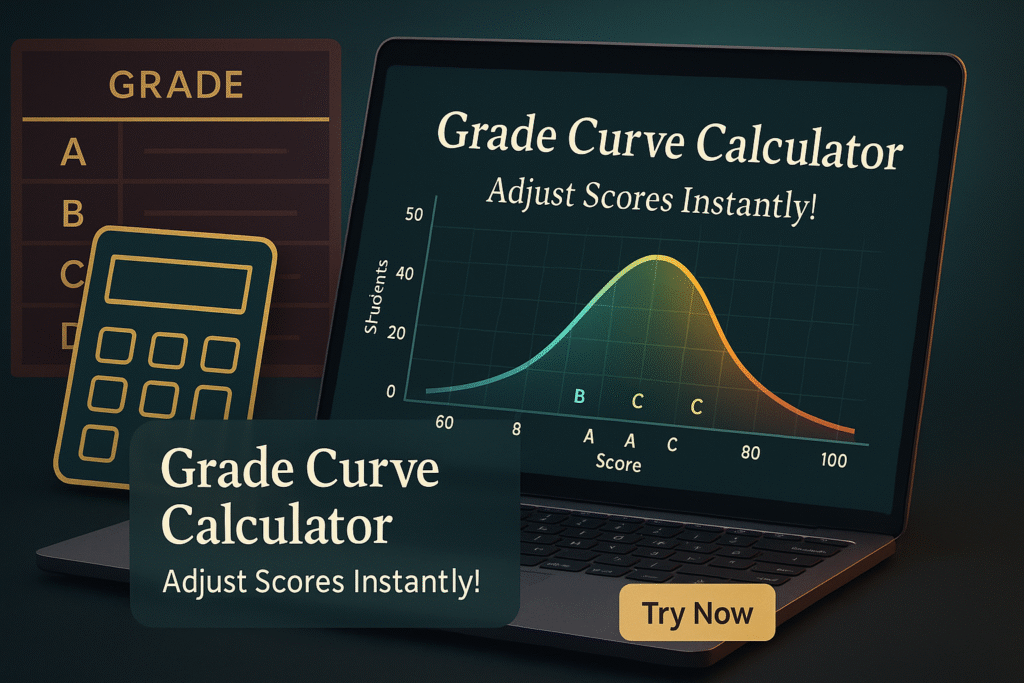
Grade Curve Calculator
Adjust class grades with bell curves, linear scaling, and top score matching
Input Grades
Results
| # | Original Score | Curved Score | Difference | Percentage |
|---|
About Grade Curving
What is grade curving?
Grade curving is a method of adjusting student grades to account for variations in test difficulty or performance distribution. This calculator provides several curving methods to help educators fairly adjust class scores.
Curving Methods Explained
Bell Curve (Normal Distribution)
Adjusts grades to fit a normal distribution centered around your target mean. This method ensures most grades cluster around the average, with fewer at the extremes.
Linear Scaling
Applies a fixed percentage increase or decrease to all grades. For example, adding 10% to each score.
Top Score Matching
Makes the highest score equal to the maximum possible score (e.g., 100%), then scales all other scores proportionally.
Fixed Point Adjustment
Adds or subtracts a fixed number of points from each grade (e.g., +5 points to every score).
Grade Curve Calculator 2025: The Ultimate Guide to Fair Grading
In 2025, with evolving standards in education and assessment, instructors and students alike seek clarity on grade curving. A Grade Curve Calculator is a powerful tool to adjust and scale scores — but with multiple methods available, it’s essential to understand when and how to apply each one.
This guide explores:
- Why grade curving matters in 2025
- Common curving methods & formulas
- Step‑by‑step examples
- How to choose and apply the right method
- Pitfalls & best practices
- Free calculator resources
- Tips for students and teachers
Let’s dive in!
1. What is Grade Curving and Why It Matters in 2025?
Grade curving is the process of adjusting raw exam scores to achieve fairness — particularly when assessments are unexpectedly difficult, or grading scales vary. It ensures that students aren’t unfairly penalized due to test design issues or unforeseen circumstances.
Why Curving Remains Vital in 2025
- Consistency Across Formats
With hybrid classes (online/in-person) more prevalent, curving helps standardize grading across different formats. - Fairness for Hard Exams
When an exam is unexpectedly tough, raw scores may cluster low; curving rebalance results. - Transparency and Trust
Explaining curving methods explicitly builds student confidence in grading processes. - Adapting to Diverse Cohorts
With more diverse learners and assessment styles, curves help adjust for group performance differences.
2. Common Grade Curve Methods & Formulas
Here are the most widely used systems in 2025:
A. Simple Add‑On / “Difference” Curve
Adjusts scores by adding a fixed number of points based on the gap between the highest achieved score and the maximum possible score.
- Formula:
Curved Grade = Original Grade + (Max Possible – Highest Achieved) - Example:
Max possible = 100, highest earned = 85, gap = 15
A student with 75 → 75 + 15 = 90
Pros: Simple; ensures top student scores 100%.
Cons: All students get identical boost—even top performers—can produce inflated grades.
This approach is used by many online calculators calcunation.com+7onlinegradecalculator.io+7easygpacalculator.com+7blaze.today+6studycrumb.com+6onlinegradecalculator.io+6easygpacalculator.com.
B. Ratio / Proportional Curve
Scales each score proportionally based on the ratio of max possible to highest achieved.
- Formula:
Curved Grade = Original Grade × (Max Possible / Highest Achieved) - Example:
Highest = 95; student scored 80
→ 80 × (100/95) ≈ 84.21% onlinegradecalculator.io+3calculator.academy+3calculatorflares.com+3
Pros: Maintains relative differences between students.
Cons: Even top student capped at 100%, lower performers may not gain enough.
C. Linear Curve Based on Class Average
Adjusts scores so the class average aligns with a desired average.
- Formula:
Adjustment = Desired Avg – Current AvgCurved Grade = Original + Adjustment
Tools like SFTP tutor solutions outline this test-ninjas.com+5sftptemp.baas.arizona.edu+5studycrumb.com+5.
Pros: Tailored to class performance; intuitive.
Cons: Low/high scores shift equally—could unfairly affect extremes.
D. Bell Curve (Gaussian / Z‑Score) Method
Relies on statistics — mean and standard deviation (σ) — to shift grades toward a new target distribution.
- Formula:
Z = (Raw – Mean) / σCurved = Z × Desired σ + Desired Mean - Example (EECS 280, Spring 2025):
Raw mean = 69%, σ = 17; target = mean 81%, σ 9. Student with 60%:
Z = (60−69)/17 ≈ –0.529
Curved = (–0.529 × 9) + 81 ≈ 76.24% test-ninjas.com+12eecs280.org+12sftptemp.baas.arizona.edu+12
Pros: Creates normal distribution; more nuanced.
Cons: Requires stats, assumptions about distribution; can disadvantage outliers.
E. Square‑Root Curve (Top Hat Approach)
Applies square-root transformation before scaling:
- Formula:
Transformed = sqrt(Raw) × 10 - Example: 90% → √90 ≈ 9.49 × 10 = 94.9% tophat.com
Pros: Boosts mid-range scores; caps naturally.
Cons: Less intuitive; less common.
3. Compare Curve Methods at a Glance
| Method | Formula | Pros | Cons |
|---|---|---|---|
| Add‑On | OG + (Max – Highest) | Simple, gets top to 100% | Flat boost, inflates everyone equally |
| Ratio | OG × (Max / Highest) | Keeps relative differences | Scales down top performers |
| Linear by avg | OG + (Desired Avg – Actual Avg) | Adjusts to class average | Can over/under boost extremes |
| Bell Curve (Z‑score) | Z = (OG–μ)/σ → Z×targetσ + targetμ | Statistically robust | Complex, needs stats, assumes normality |
| Square‑Root | √OG × 10 | Boosts average, caps automatically | Less transparent, uncommon |
4. When to Use Each Method
1. Simple Add‑On
- Best when all scores low due to test difficulty.
- Works well for small classes or uniform score drops.
2. Ratio
- Ideal when relative performance should be preserved.
- Useful if highest student deserves to stay near top.
3. Linear
- When wanting to set class average to a target (e.g., 75%).
- Best for moderate performance variation.
4. Bell Curve
- When class scores roughly follow a normal distribution.
- Used by larger courses/calculated labs (e.g., EECS 280) calculatorflares.comcalculatorflares.com+7sftptemp.baas.arizona.edu+7easygpacalculator.com+7tophat.com+1easygpacalculator.com+1blaze.today+8eecs280.org+8sftptemp.baas.arizona.edu+8calculator.academy+2easygpacalculator.com+2onlinegradecalculator.io+2gpacalculator.net.
5. Square‑Root
- When mid-range scores need encouragement.
- Often seen in platforms like Top Hat calculator.academy+12tophat.com+12onlinegradecalculator.io+12.
5. Step‑by‑Step Examples
Example A: Add‑On / Difference
- Max = 100, Highest = 88 → Gap = 12
- Student A: 70 → 82
- Student B: 88 → 100
Example B: Ratio
- Highest = 92
- A scored 75 → 75 × (100/92) ≈ 81.52
Example C: Bell Curve
- μ = 70, σ = 15; target μ = 80, σ = 10
- Score = 55 → Z = (55–70)/15 = –1
- Curved = (–1 × 10) + 80 = 70
Example D: Square‑Root
- Raw = 64% → √64 × 10 = 80%
6. Free 2025 Grade Curve Calculators (Online Tools)
• Calculator Academy (Scaling/Ratio)
Implements SG = OG × 100/MG, updated May 2025 reddit.com+4calculatorflares.com+4easygpacalculator.com+4sftptemp.baas.arizona.edu+3easygpacalculator.com+3studycrumb.com+3sftptemp.baas.arizona.edutophat.com+7calculator.academy+7easygpacalculator.com+7eecs280.org.
• Text Blaze (Add‑On template)
Simplifies adding point-difference curves easygpacalculator.com+1calculatorflares.com+1.
• EasyGPACalculator
Offers add-on, ratio, and bell-curve calculators .
• CalcuNation (Bell Curve)
Builds grading scale based on population and normal distribution sftptemp.baas.arizona.edu+7calcunation.com+7easygpacalculator.com+7.
• SFTP Solutions (Linear)
Guides linear avg-based curving dulab.phys.rice.edu+3sftptemp.baas.arizona.edu+3calculator.academy+3.
• Top Hat / Study platforms
Use advanced stats like sqrt-curving test-ninjas.com+11tophat.com+11calculator.academy+11.
7. Best Practices for Curving
- Explain your method early. Share formulas and reasons with students upfront.
- Check score distribution. Use histograms or stats to guide method choice.
- Avoid over-curving. Over-inflated grades lose meaning.
- Apply caps. Prevent exceeding 100% or lowering top achievers.
- Reflect on results. Use curving insights to improve teaching/assessment.
8. Drawbacks & Considerations
- The Top End Dilemma: Top students may see minimal impact or unfair scaling with additive methods.
- Competition vs Collaboration: Bell curves can foster unhealthy competition dulab.phys.rice.edu+7tophat.com+7studycrumb.com+7easygpacalculator.com+1calculatorflares.com+1.
- Masking Problems: Curving might hide flaws in instruction or exam design calculator.academy+2easygpacalculator.com+2calculatorflares.com+2.
- Complexity: Statistical methods like bell curves require careful calculation.
9. Tips for Teachers and Institutions (2025 Edition)
- Use analytics tools (e.g., LMS stats) to inform curving needs.
- Communicate transparently, ideally show example calculations.
- Benchmark year-over-year, e.g., EECS 280 uses target stats such as 81% mean, 9% σ studycrumb.com+3easygpacalculator.com+3onlinegradecalculator.io+3eecs280.org.
- Train TAs and staff on curve usage and rationale.
- Collect student feedback to assess perceptions of fairness.
10. What Students Should Know
- Ask how your instructor plans to curve and which method they’re using.
- Forecast your curved score: Most online calculators let you plug in stats.
- Understand percentiles vs. absolute scores, especially under bell-curve structures.
- Keep striving—curves can shift grades, but raw performance still matters.
11. Setting Up Your Own 2025 Calculator (DIY Guide)
You can build your own curve calculator using Excel, Google Sheets, or Python:
Spreadsheet Setup:
| A | B | C |
|---|---|---|
| 1 | Max Possible | 100 |
| 2 | Highest Achieved | =MAX(range of scores) |
| 3 | Original Score | input |
| 4 | Add-On Curve | =A1−A2 |
| 5 | Curved Score (Add-On) | =A3 + A4 |
Similar formulas can be created for ratio:=A3 * (A1 / A2)
Python Snippet for Bell Curve:
pythonCopyEditdef bell_curve(raw, mean, std, desired_mean, desired_std):
    z = (raw - mean) / std
    curved = z * desired_std + desired_mean
    return max(raw, curved)  # no downward curves
This follows the EECS 280 approach reddit.comeecs280.org+1reddit.com+1.
12. SEO Tips: Rank Your “Grade Curve Calculator 2025” Content
- Key phrase: “grade curve calculator 2025” (title, headers, intro).
- Long‑tail variants: “how to curve grades 2025”, “grade curve method 2025”.
- Include examples using real data (e.g., 2025 stats).
- Embed visual: histogram or formula image in article.
- Link resource pages like Calculator Academy, Text Blaze, EasyGPACalculator.
- Use FAQs (e.g., “Which curve is fairest?”)
13. FAQs
Q1: Can I use multiple methods at once?
Only if clearly justified—e.g., add-on + bell curve—but document it thoroughly.
Q2: Will curving boost my GPA?
Depends—add-on boosts evenly, bell curve redistributes relative standing.
Q3: Are curves legally regulated?
Not usually; but transparency and consistency (across semesters/courses) is increasingly essential.
14. Conclusion
A Grade Curve Calculator 2025 is more than a quick math tool—it’s a transparent, data-driven approach to fair grading in modern education. Whether you prefer simple add-ons, ratio scaling, linear adjustments, psychologically smart methods like square-root curves, or statistically rigorous bell-curve systems, the key lies in clarity and consistency.
Explore the free tools we mentioned, build your own spreadsheet or script, and ensure curving supports both fairness and learning—without over-inflating grades. With the right approach, curving becomes a valuable part of your teaching or learning toolkit—now and for many semesters to come.